Contact Info
Tyson Ochsner
Professor
Plant and Soil Sciences
Oklahoma State University
371 Ag Hall
Stillwater, OK 74078
Phone: (405)-744-3627
tyson.ochsner@okstate.edu
|
- Info
PEET Herbicide Documentation Introduction
|
Introduction
PEET’s
Use, Database
Development,
Cautions/Disclaimers,
Inputs, and
Outputs
PEET Herbicide
Documentation
by
Shea W. Murdock, David
L. Nofziger, Don S. Murray, and
Case Medlin
Introduction:
Herbicide
application decisions in cotton and peanuts are difficult and
complex for most producers, especially with the advent of several
new, highly efficacious herbicides and the commercialization of
herbicide-resistant cotton cultivars.
These new weed management tools have made weed control
easier, but have made the decision process more complex.
Producers must now decide if, when, and what herbicides
should be applied based on economic
thresholds. The
economic threshold is complicated, difficult, and time consuming to
calculate, should be calculated for each possible herbicide option,
and should include factors such as expected crop price,
expected crop yield, weed species and population, weed-crop
competition, herbicide price, and herbicide efficiency.
Due to the complexity of these calculations, most producers
rely on others to make their herbicide decisions.
However, a computer “Decision Support System” (DSS) can
aid producers in making these difficult and complex weed control
decisions.
With inputs from the user, PEET (Predicting Environmental
& Economic Tradeoffs…) compares the economic benefits and
potential groundwater hazards of various herbicide treatments.
The complex calculations are performed in real-time, giving
the producer many herbicide options to choose from in a matter of
seconds. Like
all computer models, PEET is not intended to replace human knowledge
in decision-making, but only to “aid” in the process.
Database development:
For
models and equations used in PEET, see the PEET Documentation
section in the “Help” menu. The PEET databases were developed from the knowledge of
Oklahoma State University weed and soil scientists.
The weeds in the database are common to most Oklahoma cotton
and peanut fields. Herbicide
rates and application information are based on manufacturers’
labels. Herbicide
efficacies (i.e. percent control of a weed by a herbicide treatment)
were derived from research trials performed in Oklahoma and
surrounding states when possible, and from herbicide labels in
conjunction with conservative estimates when research was not
available. Treatment
efficacies depend upon the weed species, size, soil moisture, and
environmental conditions.
Competitive
indices,
CI’s, are scores of the competitiveness of a weed species with a
crop. CI’s are
generally based on and validated with years of weed competition
research, but estimates are used when needed (Figure 1.).
|
|
|
 |
|
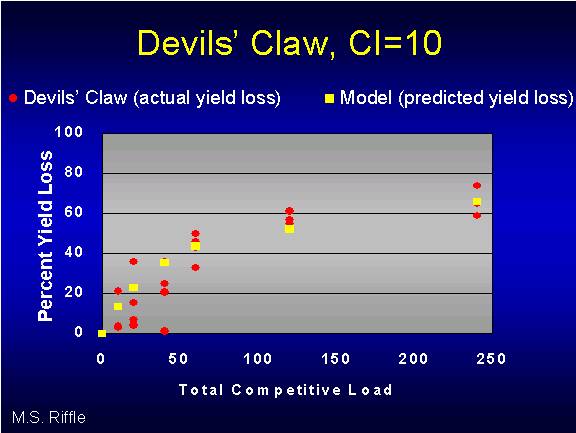
Figure
1. The
chart above depicts devils’-claw (·)
with a CI of 10, the highest CI rating, with the yield prediction
loss of the model (■).
The actual cotton yield loss resulting from devils’-claw
competition, attained from weed versus crop competition research
performed at OSU, is plotted against the total competitive load (TCL),
which was obtained by multiplying the weed density by the CI.
The model’s prediction is also included to compare the
accuracy of the model in predicting the yield loss for
devils’-claw at the corresponding TCL levels.
Validation of the
data: Field experiments were conducted during the last several years
to assess the accuracy or dependability of PEET compared to human
recommendations. Each
year small adjustments were made to the program to increase PEET’s
accuracy. Currently,
PEET has been field validated in Oklahoma and the weed control
recommendation treatments from PEET closely match those of OSU Weed
Scientists.
Cautions/Disclaimers:
-
The
use of brand names does not imply endorsement of products nor the
exclusion of others. Brand
names are used only for recognition purposes of a herbicide by the
producer.
-
PEET
should be used with caution in areas outside of Oklahoma where
general crop growing conditions, varieties, climate, rainfall, weed
species, and soils may differ from areas where PEET was developed
and field tested.
-
PEET
should only be used as a decision “aid” and not as an absolute
for herbicide recommendations.
-
Always
read and follow label directions.
Recommendations from PEET do not contain information
concerning surfactants, additives, or adjuvants, so follow the
manufacturers’ guidelines.
-
Inaccurate
inputs may result in poor recommendations.
-
Continue
to monitor weed problems after an application, new weed populations
may occur.
-
Weed
control may vary due to environmental conditions specified on the
manufacturer’s label.
INPUT
Information/Screens:
PEET
consists of an active screen with nine tabs across the top.
The first four tabs require data from the user.
The “Field/Treatments” tab is active upon opening PEET.
The user inputs the appropriate information and moves to the
next tab until all information is entered.
The next four tabs supply the herbicide recommendations and
the ground water potential hazards based on the user’s inputs.
Following is a step by step pictorial of the tabs explaining
the required inputs and the output from PEET.
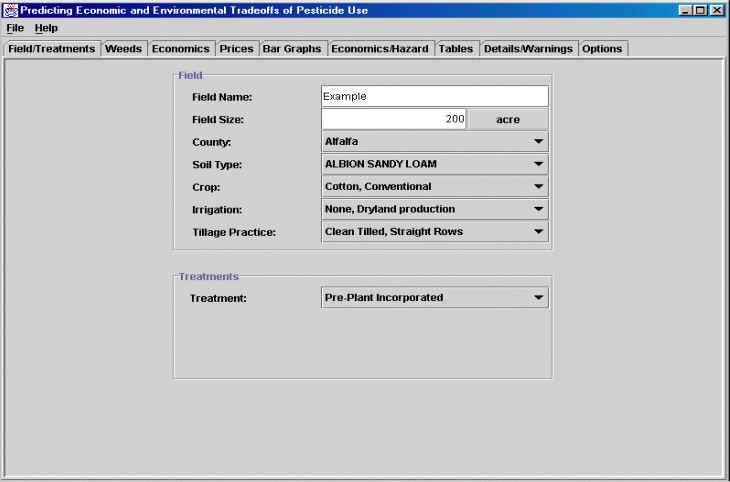
Field/Treatment:
This screen, illustrated below, allows the user to enter a field
name and size, for archiving and/or retrieving data at a later date.
Selections of county, soil type, irrigation, and tillage are
needed for calculating groundwater hazards of the various
herbicides. Soil
texture and organic carbon content also influence the efficacy of
some treatments.
This
screen, illustrated below, allows the user to enter a field name and
size, for archiving and/or retrieving data at a later date.
Selections of county, soil type, irrigation, and tillage are
needed for calculating groundwater hazards of the various
herbicides. Soil
texture and organic carbon content also influence the efficacy of
some treatments.
|
|
|
|
|
County:
This is a drop down listing of the counties in Oklahoma where
the respective crops are grown.
Simply click on the county and select the appropriate county
from the drop-down menu. Once
the county is selected, the Soil Type will default to the
soil type most commonly associated with that county.
However, other soil types can be selected from the drop-down
menu. Then the Crop
should be selected from the conventional and herbicide resistant
crops options. If a
herbicide resistant crop is chosen, treatments displayed in the
output will consist of all conventional and specialty herbicide
options; i.e. selection of Roundup Ready cotton may result in the
display of Roundup (glyphosate) treatments along with Staple, Poast,
MSMA, etc. treatments. However
if conventional cotton is selected then glyphosate or Buctril will
not be possible treatment options.
NOTE: PEET does not
take into account the seed technology fees incurred with purchasing
herbicide resistant seed. Irrigation:
the user can select between the most appropriate type of irrigation
used on their field. Treatment:
In this example the treatment type chosen was pre-plant
incorporated. There are
three or four treatment types depending on the crop selected.
The results displayed by PEET correspond to the selected type
of application and any following applications that may occur.
In this case, the results will be displayed for preplant
incorporated (PPI), preemergence (PRE), postemergence(POST), and
postemergence directed/hooded spray (PDS/HOODED), for cotton. If POST or PDS/HOODED are selected, the lower box also
requires inputs of the soil moisture, approximate weed size (average
weed height), and application date.
After this information is entered, move to the next tab by
clicking Weeds at the top of the screen.
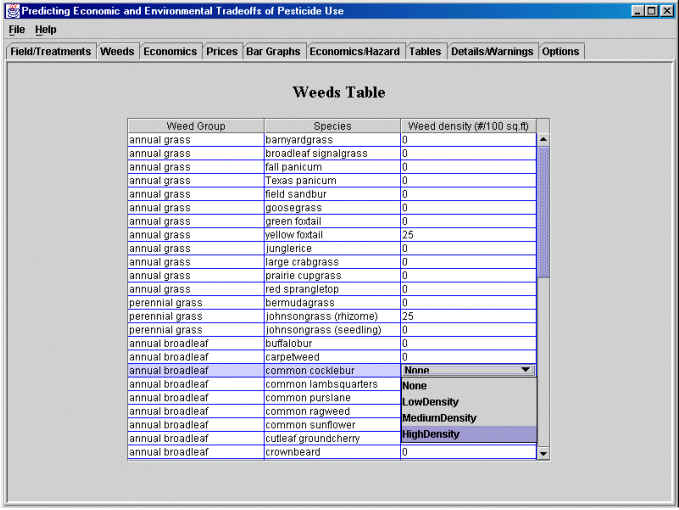
Weeds:
This screen is used to enter
the weed species and densities present in the field.
Weed species are listed by common name in weed groups, (i.e.
annual grasses, annual broadleaves, etc.) to help the user locate
the weed species. Proper
identification and accurate weed densities are essential in order
for the user to get meaningful and accurate recommendations from
PEET. Since weeds are
not present to determine their densities for PRE treatments, the
user can specify densities Low, Medium, or High.
Weed density should be
entered in the format of weed numbers/100 sq. ft.
The density levels will be converted to numeric values, using
estimates defined in the database by the program developers.
The default numeric values for Low, Medium, and High are
species specific. In
the example below the user selected a low density of yellow foxtail,
a medium density of rhizome Johnsongrass, and is selecting a high
density of common cocklebur.
|
|
|
 |
|
When entering weed densities
for POST treatments, the user should properly scout the field to
assess the weed species present and get the most accurate weed
densities and heights. To
properly scout the field, the user should take weed counts at
several sites (minimum of six) in each field.
Then the weed densities (# / 100 sq. ft.) can be entered for
each weed species in the field.
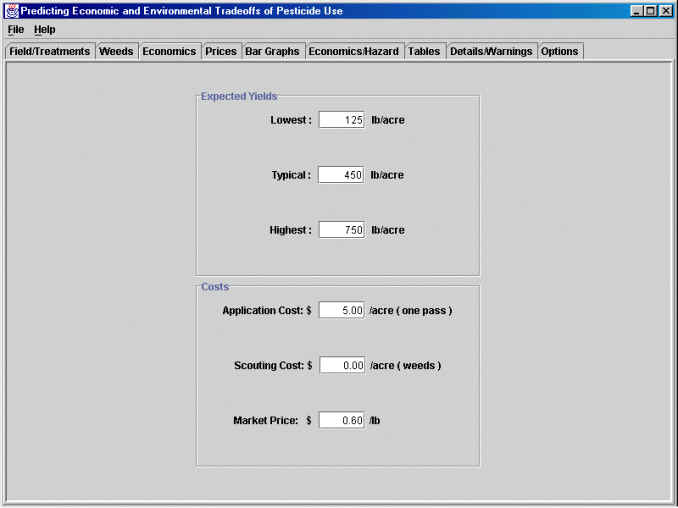
Economics:
This screen is used to enter
expected yield and market price of the crop, as well as the
application and scouting costs.
There are defaults set in PEET for the crop and irrigation
type already selected by the user.
The Expected Yields should be the lowest, typical
(average), and highest yields expected for that field.
Application costs is the cost the user will incur for one
application pass through the field.
If a custom applicator is making the application, then enter
the cost the applicator charges for a single application.
The application cost
should not include the cost of the herbicide, as the herbicide cost
is included in the program.
|
|
|
 |
|
Prices:
This screen is used to enter prices of different
herbicides. Default
values are stored in the database, but the user can enter the
herbicide prices from their local herbicide supplier.
These values are needed to calculate the treatment cost and
determine the economic gain. The
cost of a herbicide plays an important role in the final
recommendations and the user should enter the prices that they will
pay for the individual herbicides.
The user can save their adjusted herbicide price list (go to
file, then “save herbicide data”).
When using the program at a later time, the users can use
their prior edited price list (go to file, then choose “load local
herbicide data”).
OUTPUT:
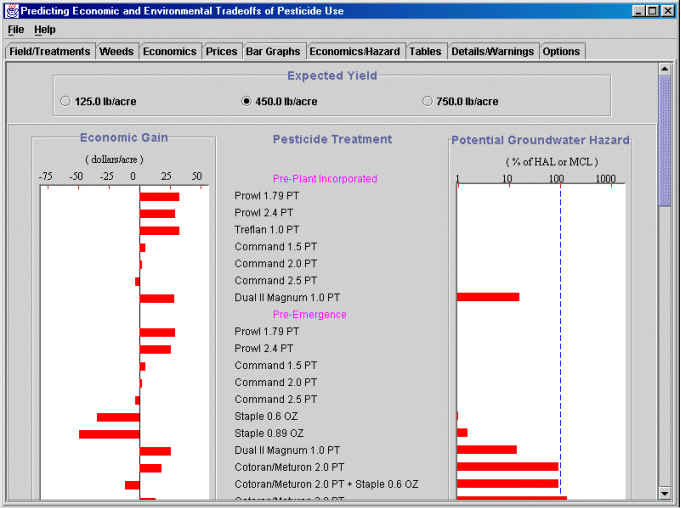
Bar graphs:
The figure below
presents partial results of a simulation and economic analysis in
the form of bar graphs. The list at the center of the figure
contains different herbicide treatments and application rates.
Additional bars and treatment descriptions for POST and PDS/HOODED
treatments are available by scrolling through the list.
|
|
|
 |
|
The bar graph on the left
shows the estimated economic gain corresponding to each treatment
for the weed species and densities specified by the PEET user
assuming a weed-free yield of 450 lb/acre.
The user can view the results from the other expected yields
by simply clicking on the yield of interest (i.e. 125 or 750
lb/acre) at the top of the screen.
Economic gain is the estimated $/acre the user will gain from
using a treatment. The
bar graph on the right shows the groundwater hazard index (on a
logarithmic scale) for each treatment.
Together, these bar graphs can be used to select a treatment
with a high economic gain and low groundwater hazard. In some cases, this is not possible so tradeoffs must be
made.
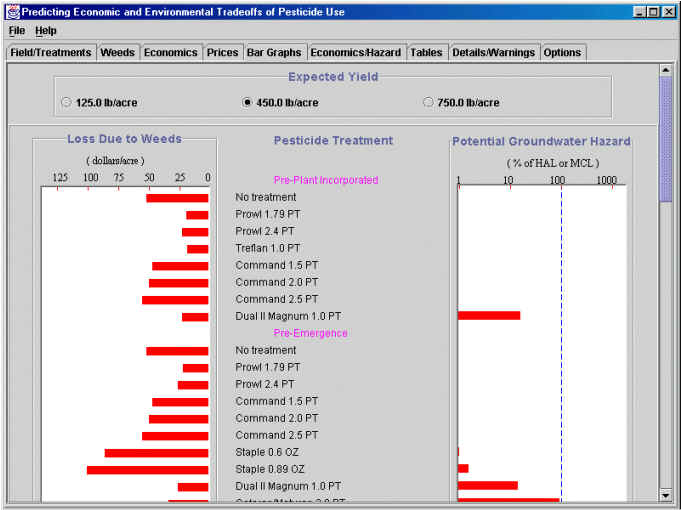
The figure below is an
alternative form of the bar graph seen above.
In this case the
user
has chosen to view the expected economic loss due to the weeds after
treatment application. The
user can switch between economic gain and loss under the Options
tab Here bars are also shown for the case in which no treatment is
made. The user can observe the impact of different expected
weed-free yields by selecting the yield of interest at the top of
the screen.
|
|
|
 |
|
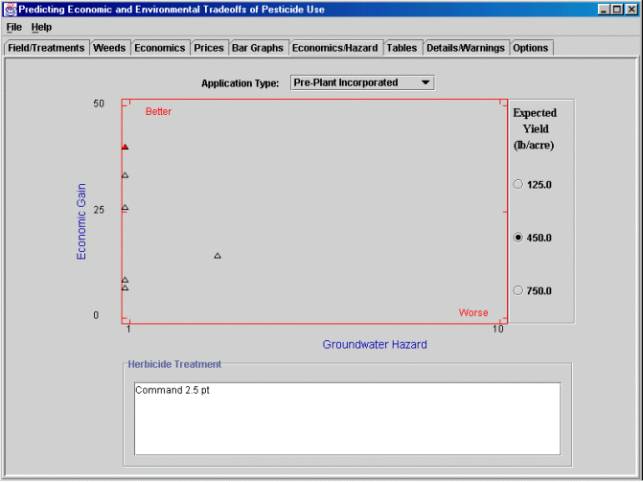
Economic Gain – Groundwater Hazard Graph:
The economic gains and groundwater hazards for each entry are
plotted on the Y and X axes, respectively.
The treatment associated with each triangle can be viewed by
clicking the triangle of interest.
In this example, the user has selected the triangle in the
upper left corner. The
treatment name is displayed in the box under the graph.
The preferred treatment option is one that maximizes economic
gain and minimizes environmental hazard, therefore, treatments near
the upper left corner of the graph are preferred.
This illustration shows results for Pre-Plant Incorporated
treatments and an expected yield of 450 lb/acre.
Results for the other application types and expected yields
can be shown by selecting other application types and yields on this
screen.
|
|
|
 |
|
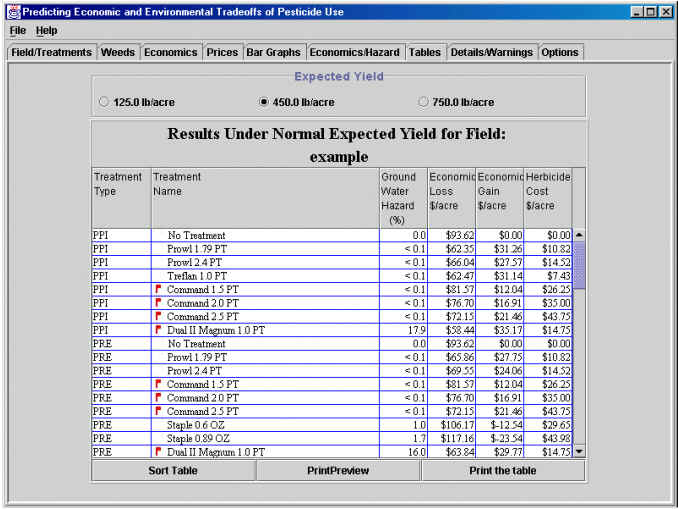
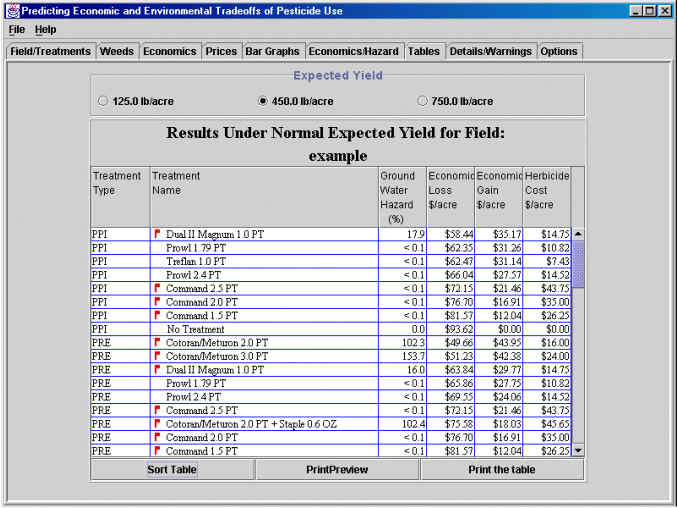
Tabular Output:
The
output of PEET is also available in a table format as shown below.
|
|
|
 |
|
Here
the treatment type and name are displayed along with the estimated
groundwater hazard (%), economic loss ($/acre), economic gain
($/acre), and herbicide cost ($/acre).
This table can be displayed for any of the expected weed-free
yields displayed at the top of the table.
The table can be sorted by groundwater hazard, economic loss,
economic gain, or herbicide cost.
Sorting allows the user to view the treatment options in
increasing or decreasing order, and within or across all treatment
types. To sort, simply
click on the Sort Table button in the lower left corner or
double click on the column title of interest.
A sort screen will appear, click the button that corresponds
to the desired sorting preference.
The table below has the same recommendations sorted by
economic gain in decreasing order within treatment type.
|
|
|
 |
|
Note: Although
the estimated gain and loss are displayed to the nearest $0.01 per
acre, the model and the parameters used in estimating these values
are not that accurate. Consider any treatments that have economic gains/losses within 10-15%
as equals.
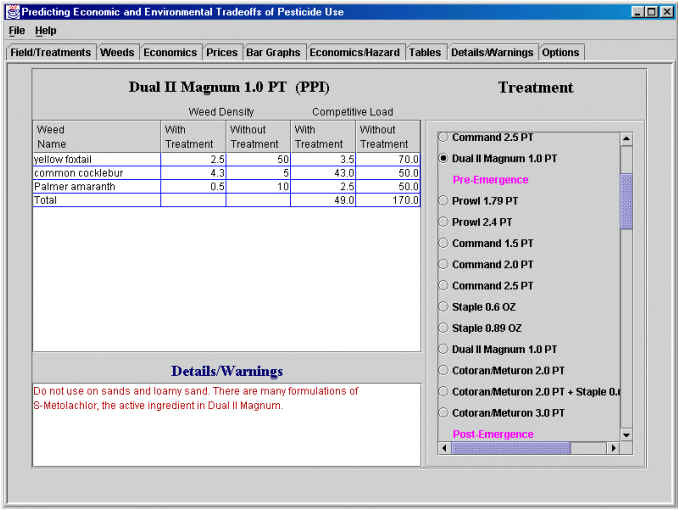
Some
lines in the table shown above include flags.
This indicates that special instructions or warnings exist
for these treatments. By
selecting a particular treatment, a screen opens to provide
additional information for that treatment (see in figure below).
This information can also be obtained for all treatments by
selecting the “Details/Warnings” tab on the screen.
In
addition to the Details/Warnings about the use of the
herbicide and a note that other trade names are available for some
active ingredients, this screen displays the weed densities and
competitive load before and after treatment.
This information can be used to evaluate the need for
subsequent treatments. To
change between the treatments, click on the treatment of interest in
the column at the right.
|
|
|
 |
Contact
D.L. Nofziger at david.nofziger@okstate.edu for more
information about this software and its use for other crops and geographic
areas.
Last
Modified: January 16, 2008
|